Updates

  1. Search groups its results by kind: people, companies, geographies, subjects, topics, books, funds, fund letters and papers.
  2. The Books table lists who recommended each book by name, and the browser tab names the section you are in.
  3. Feedback can take a screenshot of the page, or one you paste or choose, and opens in the corner beside Updates.
  4. Each rail button reopens its section where you left it, and Browse, Table and People show on every book and subject page.
  5. Filters grey out choices that hold nothing instead of hiding them, and Books › People filters by authors or recommenders.
  6. Feedback takes a subject line and up to three screenshots.
  7. Biographies are grouped by the person they are about: 41 new pages, from Abraham Lincoln to Lee Kuan Yew.
  8. Sport splits into 23 sports, and Religion into one topic per faith.
  9. Book lists show as cards: the cover, one recommendation quote and every recommender by name.
  10. Seventeen subjects that had two or three pages under different names now have one page each.
  11. Every page lists its Experts as authors and recommenders, with a link to them on the Experts tab.
  12. Economics, Financial history, Financial panics and Accounting are subjects of their own, with one page per financial crisis.
  13. Book, person and subject pages open inside the app, so the tabs stay in view.
  14. 996 more book covers, and photographs or logos for 227 more people and companies.
  15. Books › Browse shows every subject as cards, and the rail holds Fund letters, Papers, Experts, Books and Funds.
  16. Every topic over 150 books splits into narrower topics, each with a page of its own.

Send feedback

What is it?
Screenshots, up to 3 (optional)
or paste one with Ctrl+V

We use your email only to reply to you.

DV

Data Visualisation and Information Design

Holds books on charts, maps, diagrams and visual explanation, led by Edward Tufte.

16 books on Data Visualisation and Information Design, recommended by 10 people including Patrick Collison and Bret Victor.

16 books · 10 experts

Start here

  1. Powers of TenPhilip Morrison, Phylis Morrison, 1982
  2. The Visual Display of Quantitative InformationEdward R. Tufte, 1983
  3. The Elements of Graphing DataWilliam S. Cleveland, 1985
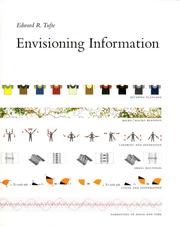
  4. Envisioning InformationEdward R. Tufte, 1990
  5. Visual ExplanationsEdward R. Tufte, 1997

The best books on Data Visualisation and Information Design 16

Philip Morrison, Phylis Morrison · 1982
Recommended byStewart Brand
Peter Barber · 2005
Recommended byStewart Brand
Garr Reynolds · 2007
Recommended byNir Eyal
David Sibbet · 2012
Recommended byAndy Budd
Krome Barratt
Recommended byBret Victor

Experts 10

The people who wrote this page's books, and the people who recommend them.

Recommenders 10

Patrick Collisonrecommends 9 books hereBret Victorrecommends 6 books hereJeff Atwoodrecommends 4 books hereStewart Brandrecommends 2 books here
AB
Andy Buddrecommends 1 book here
CB
Coleen Baikrecommends 1 book here
Daniel Burkarecommends 1 book hereJessica Hischerecommends 1 book hereKevin Roserecommends 1 book here
NE
Nir Eyalrecommends 1 book here
See all 10 in the Experts tab →

More art and design: ← Creativity and Creative Careers · Film, Television and Comedy → · All art and design