Data Visualisation and Information Design
Holds books on charts, maps, diagrams and visual explanation, led by Edward Tufte.
Start here
- Semiology of Graphics: Diagrams, Networks, MapsJacques Bertin, Georg Jensch, Dieter Schade, Wolfgang Scharfe, 1967
- Logic and DesignKrome Barratt, 1980
- Powers of TenPhilip Morrison, Phylis Morrison, 1982
- The Visual Display of Quantitative InformationEdward R. Tufte, 1983
- The Elements of Graphing DataWilliam S. Cleveland, 1985
A theoretical foundation for information visualization, from a cartographer's work.
Recommended by: Patrick Collison
Design in art, science and mathematics: number, ratio, scale and their logic.
Recommended by: Patrick Collison, Bret Victor

The relative size of things in the universe, each step adding another zero.
Recommended by: Stewart Brand
The theory and practice of designing statistical graphics, charts and tables.
“The classic text is Edward R. Tufte, The Visual Display of Quantitative Information, 2nd Ed. (Cheshire, CT: Graphics Press, 2001)” — Michael Mauboussin
Source: Feedback: Information as a Basis for Improvement, page 18
Recommended by: Jeff Atwood, Jim Collins, Michael Mauboussin and 3 others
Methods for showing data in graphs in science and technology.
Recommended by: Bret Victor
How to show complex information on flat paper or screens, with many examples.
“The bibles of information design. Nothing comparable exists.” — Bret Victor
Source: Links — Bret Victor (his five-star list)
Recommended by: Bret Victor, Jeff Atwood, Jim Collins and 2 others
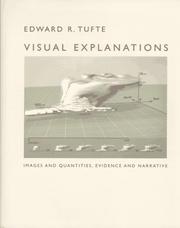
How to present information so that pictures and charts explain clearly.
“The bibles of information design. Nothing comparable exists.” — Bret Victor
Source: Links — Bret Victor (his five-star list)
Recommended by: Bret Victor, Jeff Atwood, Jim Collins and 1 other
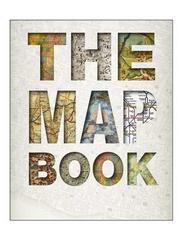
About 175 maps over four thousand years, showing how knowledge of the world grew.
Recommended by: Stewart Brand

How seeing turns into showing: turning data and evidence into explanation.
“The bibles of information design. Nothing comparable exists.” — Bret Victor
Source: Links — Bret Victor (his five-star list)
Recommended by: Bret Victor, Jeff Atwood, Patrick Collison

How to design and deliver simple, creative slide presentations.
Recommended by: Nir Eyal
How to design data visualisations as a sequence of learnable decisions.
Recommended by: Patrick Collison
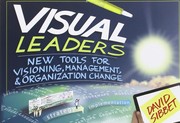
How leaders use visual tools to communicate and lead change.
Recommended by: Andy Budd
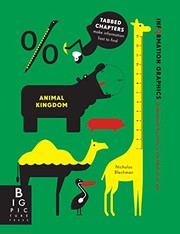
Information graphics for young readers, on animals and science.
Recommended by: Coleen Baik, Jessica Hische

Photographs that visualise data, from Wi-Fi fields to many moments in one image.
Recommended by: Patrick Collison
Euclid's first six books, with diagrams and proofs drawn in bright coloured shapes.
Recommended by: Patrick Collison
 Patrick Collisonrecommends 9 books here
 Bret Victorrecommends 6 books here
 Jeff Atwoodrecommends 4 books here
 Jim Collinsrecommends 3 books here
 Stewart Brandrecommends 2 books here
 Michael Mauboussinrecommends 1 book here
 Daniel Burkarecommends 1 book here
 Jessica Hischerecommends 1 book here
 Kevin Roserecommends 1 book here
 Nir Eyalrecommends 1 book here