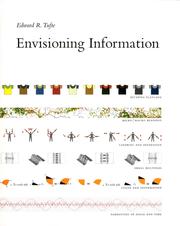
Envisioning Information
How to show complex information on flat paper or screens, with many examples.
Who recommended it 5 · 4 direct
Similar books 6
Chosen by shared topics, the entries that hold them, and the people who recommended both.
The theory and practice of designing statistical graphics, charts and tables.
“The classic text is Edward R. Tufte, The Visual Display of Quantitative Information, 2nd Ed. (Cheshire, CT: Graphics Press, 2001)” — Michael Mauboussin
Source: Feedback: Information as a Basis for Improvement, page 18
Recommended by: Jeff Atwood, Jim Collins, Michael Mauboussin and 3 others
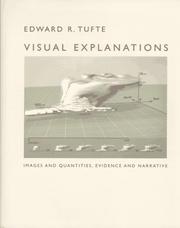
How to present information so that pictures and charts explain clearly.
“The bibles of information design. Nothing comparable exists.” — Bret Victor
Source: Links — Bret Victor (his five-star list)
Recommended by: Bret Victor, Jeff Atwood, Jim Collins and 1 other
How seeing turns into showing: turning data and evidence into explanation.
“The bibles of information design. Nothing comparable exists.” — Bret Victor
Source: Links — Bret Victor (his five-star list)
Recommended by: Bret Victor, Jeff Atwood, Patrick Collison
Methods for showing data in graphs in science and technology.
Recommended by: Bret Victor
Information graphics for young readers, on animals and science.
Recommended by: Coleen Baik, Jessica Hische
Design in art, science and mathematics: number, ratio, scale and their logic.
Recommended by: Patrick Collison, Bret Victor