Updates

  1. Person pages list letters, writing, profiles and links as sortable tables with filters, and show each person's companies as links; Fund letters show each letter's description in its own column.
  2. Experts show a checked job title and a short description of each person; 30 more people have photographs.
  3. Every company, fund, university and publication the experts work for has a page listing the people there.
  4. Fund letters show each letter's thesis and filter by it; 225 person pages list the essays, columns and newsletter issues the person wrote.
  5. Person pages list every essay and newsletter issue a person wrote, and their own books as a table in List view.
  6. Recommends shows the five largest kinds of book and the rest under More; browse pictures load sooner.
  7. Podcasts and talks link the original episode, filter by Audio and video or Press, and list each publisher once.
  8. Pages are wider, Recommends has List and Grid, and a filter clicked again turns off.
  9. Book cards sit in a ruled grid with Open Library and Goodreads links and each book's one-line note.
  10. Funds is now Investors; each investor's styles are buttons that filter the table.
  11. Podcasts and talks on a person's page filter by year and publisher and show as a list or a grid of pictures.
  12. Quotes show only people's own words: 472 summaries written by list sites are gone.
  13. Country pages open from Browse again, and every link on the shelf lands on a page.
  14. Subject and person pages show their sections as tabs, and each book appears once on a person's page.
  15. Book cards show the quote, who said it and the source; grids show five cards to a row.
  16. On a phone, a menu holds the sections, search, Updates, Feedback and dark mode.
  17. Feedback takes a screenshot of the page with no browser prompt, opens a screenshot full size when you click it, and clears itself once sent.
  18. Book cards are centred, search names the topic each book sits in, and any text cut short shows whole on hover.
  19. Search groups its results by kind: people, companies, geographies, subjects, topics, books, funds, fund letters and papers.
  20. The Books table lists who recommended each book by name, and the browser tab names the section you are in.
  21. Feedback can take a screenshot of the page, or one you paste or choose, and opens in the corner beside Updates.
  22. Each rail button reopens its section where you left it, and Browse, Table and People show on every book and subject page.
  23. Filters grey out choices that hold nothing instead of hiding them, and Books › People filters by authors or recommenders.
  24. Feedback takes a subject line and up to three screenshots.
  25. Biographies are grouped by the person they are about: 41 new pages, from Abraham Lincoln to Lee Kuan Yew.
  26. Sport splits into 23 sports, and Religion into one topic per faith.
  27. Book lists show as cards: the cover, one recommendation quote and every recommender by name.
  28. Seventeen subjects that had two or three pages under different names now have one page each.
  29. Every page lists its Experts as authors and recommenders, with a link to them on the Experts tab.
  30. Economics, Financial history, Financial panics and Accounting are subjects of their own, with one page per financial crisis.
  31. Book, person and subject pages open inside the app, so the tabs stay in view.
  32. 996 more book covers, and photographs or logos for 227 more people and companies.
  33. Books › Browse shows every subject as cards, and the rail holds Fund letters, Papers, Experts, Books and Funds.
  34. Every topic over 150 books splits into narrower topics, each with a page of its own.

Send feedback

What is it?
Screenshots, up to 3 (optional)
or paste one with Ctrl+V

We use your email only to reply to you.

DV

Data Visualisation and Information Design

Holds books on charts, maps, diagrams and visual explanation, led by Edward Tufte.

Start here

  1. Powers of TenPhilip Morrison, Phylis Morrison, 1982
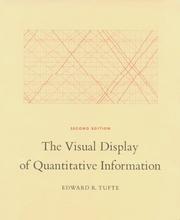
  2. The Visual Display of Quantitative InformationEdward R. Tufte, 1983
  3. The Elements of Graphing DataWilliam S. Cleveland, 1985
  4. Envisioning InformationEdward R. Tufte, 1990
  5. Visual ExplanationsEdward R. Tufte, 1997

Philip Morrison, Phylis Morrison · 1982

The relative size of things in the universe, each step adding another zero.

Recommended by: Stewart Brand
Edward R. Tufte · 1990

How to show complex information on flat paper or screens, with many examples.

Peter Barber · 2005

Recommended by: Stewart Brand

Garr Reynolds · 2007

How to design and deliver simple, creative slide presentations.

Recommended by: Nir Eyal
David Sibbet · 2012

Recommended by: Andy Budd

Euclid's first six books, with diagrams and proofs drawn in bright coloured shapes.

Recommended by: Patrick Collison

Photographs that visualise data, from Wi-Fi fields to many moments in one image.

Recommended by: Patrick Collison

More art and design