Updates

  1. Person pages list letters, writing, profiles and links as sortable tables with filters, and show each person's companies as links; Fund letters show each letter's description in its own column.
  2. Experts show a checked job title and a short description of each person; 30 more people have photographs.
  3. Every company, fund, university and publication the experts work for has a page listing the people there.
  4. Fund letters show each letter's thesis and filter by it; 225 person pages list the essays, columns and newsletter issues the person wrote.
  5. Person pages list every essay and newsletter issue a person wrote, and their own books as a table in List view.
  6. Recommends shows the five largest kinds of book and the rest under More; browse pictures load sooner.
  7. Podcasts and talks link the original episode, filter by Audio and video or Press, and list each publisher once.
  8. Pages are wider, Recommends has List and Grid, and a filter clicked again turns off.
  9. Book cards sit in a ruled grid with Open Library and Goodreads links and each book's one-line note.
  10. Funds is now Investors; each investor's styles are buttons that filter the table.
  11. Podcasts and talks on a person's page filter by year and publisher and show as a list or a grid of pictures.
  12. Quotes show only people's own words: 472 summaries written by list sites are gone.
  13. Country pages open from Browse again, and every link on the shelf lands on a page.
  14. Subject and person pages show their sections as tabs, and each book appears once on a person's page.
  15. Book cards show the quote, who said it and the source; grids show five cards to a row.
  16. On a phone, a menu holds the sections, search, Updates, Feedback and dark mode.
  17. Feedback takes a screenshot of the page with no browser prompt, opens a screenshot full size when you click it, and clears itself once sent.
  18. Book cards are centred, search names the topic each book sits in, and any text cut short shows whole on hover.
  19. Search groups its results by kind: people, companies, geographies, subjects, topics, books, funds, fund letters and papers.
  20. The Books table lists who recommended each book by name, and the browser tab names the section you are in.
  21. Feedback can take a screenshot of the page, or one you paste or choose, and opens in the corner beside Updates.
  22. Each rail button reopens its section where you left it, and Browse, Table and People show on every book and subject page.
  23. Filters grey out choices that hold nothing instead of hiding them, and Books › People filters by authors or recommenders.
  24. Feedback takes a subject line and up to three screenshots.
  25. Biographies are grouped by the person they are about: 41 new pages, from Abraham Lincoln to Lee Kuan Yew.
  26. Sport splits into 23 sports, and Religion into one topic per faith.
  27. Book lists show as cards: the cover, one recommendation quote and every recommender by name.
  28. Seventeen subjects that had two or three pages under different names now have one page each.
  29. Every page lists its Experts as authors and recommenders, with a link to them on the Experts tab.
  30. Economics, Financial history, Financial panics and Accounting are subjects of their own, with one page per financial crisis.
  31. Book, person and subject pages open inside the app, so the tabs stay in view.
  32. 996 more book covers, and photographs or logos for 227 more people and companies.
  33. Books › Browse shows every subject as cards, and the rail holds Fund letters, Papers, Experts, Books and Funds.
  34. Every topic over 150 books splits into narrower topics, each with a page of its own.

Send feedback

What is it?
Screenshots, up to 3 (optional)
or paste one with Ctrl+V

We use your email only to reply to you.

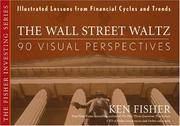
The Wall Street Waltz: 90 Visual Perspective

The Wall Street Waltz: 90 Visual Perspectives, Illustrated Lessons From Financial Cycles and Trends

Ken Fisher
1987
T4 224 pages · about 3h 44m to read Open Librarygoodreads

Summary

Ken Fisher assembled ninety charts of long-run financial and economic data and wrote a short commentary on each. The book's premise is that most investment beliefs collapse when confronted with a long enough data series, and that a chart makes the point faster than an argument.

The charts cover long series on interest rates, inflation, equity valuations, dividend yields, commodity prices, government debt, currency values, price-earnings ratios and market returns, many of them extending back into the nineteenth century. Fisher uses them to attack specific beliefs: that current debt levels are unprecedented, that current valuations are extreme, that inflation follows deficits reliably, that particular indicators forecast market direction.

His method is to show that whatever condition currently alarms investors has occurred before with varying consequences, and that the relationships people assert are weaker in the data than in the commentary. The book has been revised across editions to extend the series. Its weakness is that Fisher's commentary sometimes overstates what a chart establishes, and that showing a condition has occurred before does not establish that its consequences will be the same. The assembly of long historical series in visual form is genuinely useful and unusual, and the discipline of looking at a long series before forming a view is the right one.

Key takeaways 7

  1. Conditions that alarm investors as unprecedented have almost always occurred before with varying consequences.
  2. Long historical data series show weaker relationships between economic indicators and market returns than commentary asserts.
  3. Government debt levels described as unprecedented have been exceeded in earlier periods without the predicted outcomes.
  4. Fisher argues that looking at a long series before forming a view is the single most useful research discipline available.
  5. A chart establishes that something happened and does not establish why or whether it will happen again, which Fisher sometimes elides.
  6. Valuation measures presented as extreme are frequently within historical ranges once the series is extended far enough.
  7. The visual assembly of long financial series is unusual and useful independently of the commentary attached.

Who should read it

Investors who want long historical data series in visual form as a check against claims that current conditions are unprecedented.

About Ken Fisher

Founder and Executive Chairman, Fisher Investments; Forbes "Portfolio Strategy" columnist 1984-2016

A long, public money-management record plus Super Stocks, which introduced the price-to-sales ratio and outlived its news cycle.

Fisher Investments, Forbes

Similar books 6

Chosen by shared topics, the entries that hold them, and the people who recommended both.

Russell Napier · 2005

What markets looked like at the US stock bottoms of 1921, 1932, 1949 and 1982.

Jason Zweig, Rodney N. Sullivan · 2010

Edited collection of Graham's own writings and interviews

Where it sits in the reference 2

Investors
Financial history

Topics

Financial HistoryInvesting