Updates

  1. Person pages list letters, writing, profiles and links as sortable tables with filters, and show each person's companies as links; Fund letters show each letter's description in its own column.
  2. Experts show a checked job title and a short description of each person; 30 more people have photographs.
  3. Every company, fund, university and publication the experts work for has a page listing the people there.
  4. Fund letters show each letter's thesis and filter by it; 225 person pages list the essays, columns and newsletter issues the person wrote.
  5. Person pages list every essay and newsletter issue a person wrote, and their own books as a table in List view.
  6. Recommends shows the five largest kinds of book and the rest under More; browse pictures load sooner.
  7. Podcasts and talks link the original episode, filter by Audio and video or Press, and list each publisher once.
  8. Pages are wider, Recommends has List and Grid, and a filter clicked again turns off.
  9. Book cards sit in a ruled grid with Open Library and Goodreads links and each book's one-line note.
  10. Funds is now Investors; each investor's styles are buttons that filter the table.
  11. Podcasts and talks on a person's page filter by year and publisher and show as a list or a grid of pictures.
  12. Quotes show only people's own words: 472 summaries written by list sites are gone.
  13. Country pages open from Browse again, and every link on the shelf lands on a page.
  14. Subject and person pages show their sections as tabs, and each book appears once on a person's page.
  15. Book cards show the quote, who said it and the source; grids show five cards to a row.
  16. On a phone, a menu holds the sections, search, Updates, Feedback and dark mode.
  17. Feedback takes a screenshot of the page with no browser prompt, opens a screenshot full size when you click it, and clears itself once sent.
  18. Book cards are centred, search names the topic each book sits in, and any text cut short shows whole on hover.
  19. Search groups its results by kind: people, companies, geographies, subjects, topics, books, funds, fund letters and papers.
  20. The Books table lists who recommended each book by name, and the browser tab names the section you are in.
  21. Feedback can take a screenshot of the page, or one you paste or choose, and opens in the corner beside Updates.
  22. Each rail button reopens its section where you left it, and Browse, Table and People show on every book and subject page.
  23. Filters grey out choices that hold nothing instead of hiding them, and Books › People filters by authors or recommenders.
  24. Feedback takes a subject line and up to three screenshots.
  25. Biographies are grouped by the person they are about: 41 new pages, from Abraham Lincoln to Lee Kuan Yew.
  26. Sport splits into 23 sports, and Religion into one topic per faith.
  27. Book lists show as cards: the cover, one recommendation quote and every recommender by name.
  28. Seventeen subjects that had two or three pages under different names now have one page each.
  29. Every page lists its Experts as authors and recommenders, with a link to them on the Experts tab.
  30. Economics, Financial history, Financial panics and Accounting are subjects of their own, with one page per financial crisis.
  31. Book, person and subject pages open inside the app, so the tabs stay in view.
  32. 996 more book covers, and photographs or logos for 227 more people and companies.
  33. Books › Browse shows every subject as cards, and the rail holds Fund letters, Papers, Experts, Books and Funds.
  34. Every topic over 150 books splits into narrower topics, each with a page of its own.

Send feedback

What is it?
Screenshots, up to 3 (optional)
or paste one with Ctrl+V

We use your email only to reply to you.

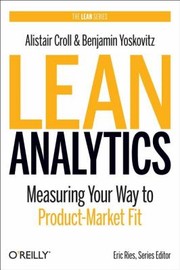
Lean Analytics

Lean Analytics

Alistair Croll, Benjamin Yoskovitz
2013
T3 440 pages · about 7h 20m to read Open Librarygoodreads

Which metric actually governs each business-model type.

Summary

Croll and Yoskovitz give a framework for choosing and using metrics in a startup, on the argument that most companies measure the wrong things and that the correct metric depends on the business model and on the stage.

Their organising concept is the One Metric That Matters, meaning that at any given stage a company should focus on a single number, because attention is limited and multiple targets produce no decisions. They pair this with the stage framework: empathy, in which the company establishes that a real problem exists; stickiness, in which it establishes that the product retains users; virality, in which it establishes that users bring others; revenue, in which it establishes the economics; and scale, in which it grows.

The business model chapters are the practical core. They give six models, which are ecommerce, software as a service, free mobile applications, media, user-generated content and two-sided marketplaces, and for each they specify the metrics that matter, the benchmark values a company should compare against, and the specific ways each model fails.

They also cover the distinction between vanity metrics and actionable ones, cohort analysis as the correct method for measuring retention, the requirement that a metric be comparative and understandable, and the practice of drawing a line in the sand, meaning stating in advance what number would count as success before running the experiment. The benchmark values are from around 2013 and have shifted substantially. The book is long for its content and repeats the framework. The model-specific metric lists and the benchmark discipline are what practitioners use.

Key takeaways 8

  1. A company should focus on a single metric at any given stage, because multiple targets produce no decisions.
  2. The correct metric depends on the business model and on the stage, so borrowing metrics from another company misdirects effort.
  3. Startups pass through stages of establishing a real problem, retention, referral, revenue and scale, and metrics differ at each.
  4. Cohort analysis rather than aggregate totals is the correct method for measuring retention, since aggregates conceal deterioration.
  5. A metric must be comparative, understandable and capable of changing behaviour, or it is not worth collecting.
  6. Vanity metrics including cumulative totals rise regardless of performance and should be excluded from any decision.
  7. A target should be stated before running an experiment, so that the result cannot be reinterpreted after the fact.
  8. Retention should be established before growth is pursued, since acquiring users into a product that does not retain them wastes the spending.

Who should read it

Founders and product teams choosing what to measure, particularly those who need model-specific metrics rather than general advice.

Who recommended it 3

Marty Caganreported
Sean Ellisreported

Similar books 6

Chosen by shared topics, the entries that hold them, and the people who recommended both.

Reid Hoffman, Chris Yeh · 2018

When and how to put speed before efficiency to capture a market before rivals.

Elad Gil · 2018

Operating manual for scaling a company from fifty to thousands

Greg Crabtree, Beverly Herzog · 2011

Owner-operator economics: labour efficiency and the four keys.

Recommended by: Nat Eliason
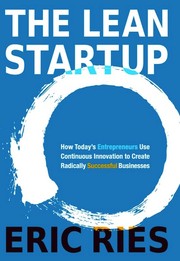
Eric Ries · 2011

Build, measure, learn: test what customers want with small experiments.

Marty Cagan · 2008

The foundational text of the modern PM role. Cagan's central argument — that most companies build the wrong things because they treat product as a delivery function rather than a discovery function — reframes everything that follows. The chapter on product discovery versus product delivery is worth the price of the book.

Recommended by: Anna Cheng, Marty Cagan

Where it sits in the reference 4

Business models
Accounting
Business themes
Business themes

Topics

Business and Management