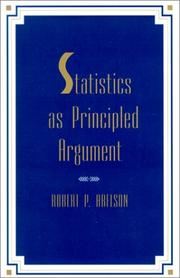
Statistics As Principled Argument
Statistical analysis as argument: how to interpret data and tell a coherent story.
Summary
The reference has not verified this book in detail; the summary states only what the title, author and subject establish.
Robert P. Abelson argues that statistical analysis is a form of argument: researchers interpret quantitative data and present it as a coherent story about their research, and that interpretation is too often neglected in favour of procedures. He addresses the problems of judging what data mean and of reporting them persuasively and honestly.
The book uses real examples from research rather than recipes for analysis. Abelson writes for beginning graduate students and experienced researchers alike, and the publisher notes that the book reads more easily than most statistics texts. It was published in 1995. Its subject is the step that comes after the calculation: deciding what a result shows, how strongly it shows it, and how to state that claim so that a sceptical reader accepts it. The available description is a short jacket blurb, so this summary covers the book's approach rather than its specific rules.
Key takeaways 4
- A statistical analysis makes an argument and should be judged as one.
- Interpreting data is a separate skill from computing results.
- Real research examples teach judgement better than analysis recipes do.
- Researchers must present findings as a coherent story without overstating them.
Who should read it
Researchers and graduate students who analyse data and want to argue honestly and persuasively from it.
Who recommended it 1 · 1 direct
Similar books 6
Chosen by shared topics, the entries that hold them, and the people who recommended both.
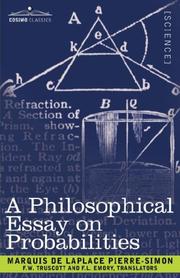
An introduction for lay readers to the concepts and uses of probability theory.
Recommended by: Patrick Collison

How seeing turns into showing: turning data and evidence into explanation.
“The bibles of information design. Nothing comparable exists.” — Bret Victor
Source: Links — Bret Victor (his five-star list)
Recommended by: Bret Victor, Jeff Atwood, Patrick Collison
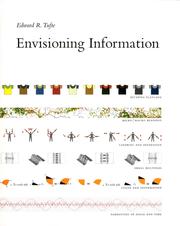
How to show complex information on flat paper or screens, with many examples.
“The bibles of information design. Nothing comparable exists.” — Bret Victor
Source: Links — Bret Victor (his five-star list)
Recommended by: Bret Victor, Jeff Atwood, Jim Collins and 2 others
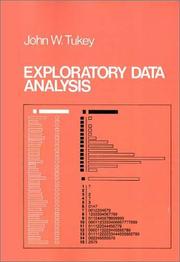
Informal ways to study data, from plots to numerical summaries done by hand.
Recommended by: Patrick Collison
The wartime theory of filtering and predicting time series, applied to engineering.
Recommended by: Patrick Collison
How biased samples, chosen averages and cut-off chart axes make numbers mislead.
“This puckish riff on how math can be manipulated is only 142 pages; most people could read it on a train ride or two, or in an afternoon at the beach. As light as the book is, however, it is nevertheless profound. In one short take after another, Huff picks apart the ways in which marketers use statistics, charts, graphics and other ways of presenting numbers to baffle and trick the public.” — Jason Zweig
Source: Best Books for Investors: A Short Shelf — jasonzweig.com
Recommended by: Bill Gates, Jason Zweig, Mohnish Pabrai and 7 others
Where it sits in the reference 2
As an Amazon Associate I earn from qualifying purchases.