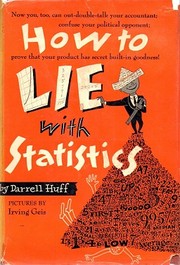
How to Lie with Statistics
How biased samples, chosen averages and cut-off chart axes make numbers mislead.
Summary
Huff wrote a short illustrated book in 1954 cataloguing the standard techniques for producing misleading numbers. It covers biased samples, the difference between mean, median and mode, the omission of sample sizes and confidence intervals, the truncated y-axis, the one-dimensional picture used to represent a doubling as a fourfold visual increase, post hoc reasoning about causation, and what he calls the semi-attached figure, where a number is presented as evidence for a claim it does not support.
The examples come from mid-century advertising, journalism and market research, including toothpaste claims, income statistics and public health reporting. The final chapter, on how to talk back to a statistic, gives five questions: who says so, how do they know, what is missing, did somebody change the subject, and does it make sense.
The book's usefulness is that the techniques have not changed. Every method Huff describes appears in modern startup metrics, in fund performance presentations and in public health reporting, with better graphics. The chart manipulation material applies directly to any dashboard, and the biased sample chapter applies to every customer survey.
There are two problems. Huff himself later testified for the tobacco industry, arguing that the statistical link between smoking and cancer was the kind of correlation his book warned against, which is a serious mark against his judgment and shows how the book's scepticism can be misused. The statistics are elementary and the book will teach nothing to anyone with quantitative training. Some examples and the illustrations are dated. It remains the best short introduction to numerical scepticism for a general reader.
Key takeaways 8
- A sample that is not random produces a number that describes only who responded, and the selection method is usually omitted from the report.
- The word average conceals which measure is being used, and mean, median and mode can be chosen to support opposite conclusions from the same data.
- A number without its sample size or its margin of error cannot be evaluated, and both are routinely omitted.
- Truncating a chart axis exaggerates a change, and the technique is used more often than any other because it survives casual inspection.
- Representing a doubling with a picture scaled in two dimensions produces a fourfold visual impression, which is deliberate rather than careless.
- A correlation is presented as a cause by simply describing it in causal language, without any claim being made that could be checked.
- A figure that supports one claim is frequently presented as evidence for a different and larger claim.
- Any statistic should be checked by asking who produced it, how they could know, what has been omitted, and whether the conclusion follows from the number given.
Who should read it
Anyone reading fund performance, startup metrics or research summaries who wants a short catalogue of how numbers are made to mislead.
Who recommended it 10 · 7 direct
“This puckish riff on how math can be manipulated is only 142 pages; most people could read it on a train ride or two, or in an afternoon at the beach. As light as the book is, however, it is nevertheless profound. In one short take after another, Huff picks apart the ways in which marketers use statistics, charts, graphics and other ways of presenting numbers to baffle and trick the public.”
“One is called How to Lie with Statistics,12 by Darrell Huff.”
Similar books 6
Chosen by shared topics, the entries that hold them, and the people who recommended both.
Statistics without the maths, for reading claims: averages, correlation, regression.
Recommended by: Keith Rabois
Why some forecasts succeed and most fail, from weather to earthquakes and economics.
“See Gigerenzer, Calculated Risks, 28-29. 14 For a book that treats this topic and more, see Annie Duke, Thinking in Bets: Making Smarter Decisions When You Don't Have All the Facts (New York: Portfolio/Penguin, 2018). 15 For a good discussion of Bayes’ Theorem, see Nate Silver, The Signal and the Noise: Why So Many Predictions Fail—But Some Don’t (New York, The Penguin Press, 2012), 232-261.” — Michael Mauboussin
Source: Confidence: Methods to Assess Confidence Under Uncertainty, page 7
Recommended by: Bill Gates, Michael Mauboussin and 2 others
How the science of cause and effect moved past 'correlation is not causation'.
Recommended by: Bill Gates, Keith Rabois, Naval Ravikant
How randomness shapes our lives, the history of probability, and why we misread it.
“I thought it was about the philosophy of randomness, but turned out to be about the math of probability. Might read again some day when in the mood for that.” — Derek Sivers
Source: Derek Sivers book notes (primary, rated list) · Rating: 3/10
Recommended by: Derek Sivers, Michael Mauboussin and 1 other
Probability and coincidence, explained for a general reader.
Recommended by: Mohnish Pabrai
What each econometric technique is for, what it assumes and what goes wrong.
Recommended by: Nassim Nicholas Taleb
Where it sits in the reference 4
Topics 4
As an Amazon Associate I earn from qualifying purchases.