Updates

  1. Person pages list letters, writing, profiles and links as sortable tables with filters, and show each person's companies as links; Fund letters show each letter's description in its own column.
  2. Experts show a checked job title and a short description of each person; 30 more people have photographs.
  3. Every company, fund, university and publication the experts work for has a page listing the people there.
  4. Fund letters show each letter's thesis and filter by it; 225 person pages list the essays, columns and newsletter issues the person wrote.
  5. Person pages list every essay and newsletter issue a person wrote, and their own books as a table in List view.
  6. Recommends shows the five largest kinds of book and the rest under More; browse pictures load sooner.
  7. Podcasts and talks link the original episode, filter by Audio and video or Press, and list each publisher once.
  8. Pages are wider, Recommends has List and Grid, and a filter clicked again turns off.
  9. Book cards sit in a ruled grid with Open Library and Goodreads links and each book's one-line note.
  10. Funds is now Investors; each investor's styles are buttons that filter the table.
  11. Podcasts and talks on a person's page filter by year and publisher and show as a list or a grid of pictures.
  12. Quotes show only people's own words: 472 summaries written by list sites are gone.
  13. Country pages open from Browse again, and every link on the shelf lands on a page.
  14. Subject and person pages show their sections as tabs, and each book appears once on a person's page.
  15. Book cards show the quote, who said it and the source; grids show five cards to a row.
  16. On a phone, a menu holds the sections, search, Updates, Feedback and dark mode.
  17. Feedback takes a screenshot of the page with no browser prompt, opens a screenshot full size when you click it, and clears itself once sent.
  18. Book cards are centred, search names the topic each book sits in, and any text cut short shows whole on hover.
  19. Search groups its results by kind: people, companies, geographies, subjects, topics, books, funds, fund letters and papers.
  20. The Books table lists who recommended each book by name, and the browser tab names the section you are in.
  21. Feedback can take a screenshot of the page, or one you paste or choose, and opens in the corner beside Updates.
  22. Each rail button reopens its section where you left it, and Browse, Table and People show on every book and subject page.
  23. Filters grey out choices that hold nothing instead of hiding them, and Books › People filters by authors or recommenders.
  24. Feedback takes a subject line and up to three screenshots.
  25. Biographies are grouped by the person they are about: 41 new pages, from Abraham Lincoln to Lee Kuan Yew.
  26. Sport splits into 23 sports, and Religion into one topic per faith.
  27. Book lists show as cards: the cover, one recommendation quote and every recommender by name.
  28. Seventeen subjects that had two or three pages under different names now have one page each.
  29. Every page lists its Experts as authors and recommenders, with a link to them on the Experts tab.
  30. Economics, Financial history, Financial panics and Accounting are subjects of their own, with one page per financial crisis.
  31. Book, person and subject pages open inside the app, so the tabs stay in view.
  32. 996 more book covers, and photographs or logos for 227 more people and companies.
  33. Books › Browse shows every subject as cards, and the rail holds Fund letters, Papers, Experts, Books and Funds.
  34. Every topic over 150 books splits into narrower topics, each with a page of its own.

Send feedback

What is it?
Screenshots, up to 3 (optional)
or paste one with Ctrl+V

We use your email only to reply to you.

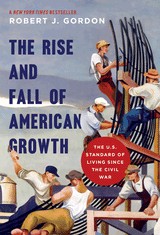
The Rise and Fall of American Growth

The Rise and Fall of American Growth

Robert J. Gordon
2016
T1 762 pages · about 12h 42m to read Open Librarygoodreads

The productivity case for why the post-1970 US grows slower than the myth.

Summary

Gordon argues that the period from 1870 to 1970 was a unique century of economic transformation that will not repeat, and that growth since 1970 has been substantially slower because the inventions of the special century were more consequential than anything since.

His evidence is a detailed reconstruction of American standards of living, covering food, clothing, housing, transport, information, health, working conditions and household production. He documents what changed: electricity, the internal combustion engine, running water and indoor plumbing, chemicals and pharmaceuticals, communications, and the elimination of much household drudgery. He argues that these transformations were one-time events, since a house can only be connected to electricity and water once, and that measured productivity statistics understate their effect because they exclude improvements in quality of life.

His analysis of the 1920 to 1970 period identifies the fastest productivity growth in American history and attributes it to the diffusion of these inventions through the economy. His argument about the recent period is that computing and communications have transformed a narrower part of life, principally entertainment, information and communication, while leaving food, clothing, housing, transport and health largely as they were in 1970. He identifies four headwinds slowing future growth: demographic change, educational stagnation, inequality and government debt.

The book is over seven hundred pages and the historical detail is the strongest part. Critics argue that Gordon understates the measurement problems in recent technology and that his headwinds are policy choices rather than constraints. The claim that transformations are one-time is the most contestable element.

Key takeaways 8

  1. The century from 1870 to 1970 produced a transformation in living standards that has not been matched since and that Gordon argues will not repeat.
  2. Electricity, plumbing, the internal combustion engine, chemicals and communications transformed every dimension of daily life within a few decades.
  3. These transformations were one-time events, since a house can be connected to electricity and running water only once.
  4. Productivity statistics understate the effect of these inventions because they exclude improvements in quality of life and in household production.
  5. Productivity growth between 1920 and 1970 was the fastest in American history and reflected the diffusion of the earlier inventions through the economy.
  6. Computing and communications have transformed entertainment, information and communication while leaving food, housing, transport and health broadly as they were in 1970.
  7. Four headwinds slow future growth, which are demographic change, educational stagnation, inequality and government debt.
  8. Critics argue that Gordon understates measurement problems in recent technology and that his headwinds are policy choices rather than constraints.

Who should read it

Investors and readers thinking about long-run growth expectations who want the detailed historical reconstruction behind the productivity slowdown argument.

Who recommended it 4 · 2 direct

“This is a heavyweight (literally) masterpiece... It's a data-rich textbook as well as a phenomenal read.”

Similar books 6

Chosen by shared topics, the entries that hold them, and the people who recommended both.
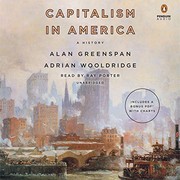
Alan Greenspan, Adrian Wooldridge · 2018

American economic growth from colonial times to now, driven by creative destruction.

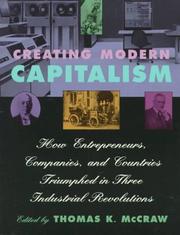
Thomas K. McCraw · 1997

How Britain, Germany, Japan and the US each built their own form of capitalism.

Recommended by: Mohnish Pabrai

Where it sits in the reference 2

Geographies
Economics

Topics

EconomicsGeneral HistoryEconomic and Business History