Updates

  1. Person pages list letters, writing, profiles and links as sortable tables with filters, and show each person's companies as links; Fund letters show each letter's description in its own column.
  2. Experts show a checked job title and a short description of each person; 30 more people have photographs.
  3. Every company, fund, university and publication the experts work for has a page listing the people there.
  4. Fund letters show each letter's thesis and filter by it; 225 person pages list the essays, columns and newsletter issues the person wrote.
  5. Person pages list every essay and newsletter issue a person wrote, and their own books as a table in List view.
  6. Recommends shows the five largest kinds of book and the rest under More; browse pictures load sooner.
  7. Podcasts and talks link the original episode, filter by Audio and video or Press, and list each publisher once.
  8. Pages are wider, Recommends has List and Grid, and a filter clicked again turns off.
  9. Book cards sit in a ruled grid with Open Library and Goodreads links and each book's one-line note.
  10. Funds is now Investors; each investor's styles are buttons that filter the table.
  11. Podcasts and talks on a person's page filter by year and publisher and show as a list or a grid of pictures.
  12. Quotes show only people's own words: 472 summaries written by list sites are gone.
  13. Country pages open from Browse again, and every link on the shelf lands on a page.
  14. Subject and person pages show their sections as tabs, and each book appears once on a person's page.
  15. Book cards show the quote, who said it and the source; grids show five cards to a row.
  16. On a phone, a menu holds the sections, search, Updates, Feedback and dark mode.
  17. Feedback takes a screenshot of the page with no browser prompt, opens a screenshot full size when you click it, and clears itself once sent.
  18. Book cards are centred, search names the topic each book sits in, and any text cut short shows whole on hover.
  19. Search groups its results by kind: people, companies, geographies, subjects, topics, books, funds, fund letters and papers.
  20. The Books table lists who recommended each book by name, and the browser tab names the section you are in.
  21. Feedback can take a screenshot of the page, or one you paste or choose, and opens in the corner beside Updates.
  22. Each rail button reopens its section where you left it, and Browse, Table and People show on every book and subject page.
  23. Filters grey out choices that hold nothing instead of hiding them, and Books › People filters by authors or recommenders.
  24. Feedback takes a subject line and up to three screenshots.
  25. Biographies are grouped by the person they are about: 41 new pages, from Abraham Lincoln to Lee Kuan Yew.
  26. Sport splits into 23 sports, and Religion into one topic per faith.
  27. Book lists show as cards: the cover, one recommendation quote and every recommender by name.
  28. Seventeen subjects that had two or three pages under different names now have one page each.
  29. Every page lists its Experts as authors and recommenders, with a link to them on the Experts tab.
  30. Economics, Financial history, Financial panics and Accounting are subjects of their own, with one page per financial crisis.
  31. Book, person and subject pages open inside the app, so the tabs stay in view.
  32. 996 more book covers, and photographs or logos for 227 more people and companies.
  33. Books › Browse shows every subject as cards, and the rail holds Fund letters, Papers, Experts, Books and Funds.
  34. Every topic over 150 books splits into narrower topics, each with a page of its own.

Send feedback

What is it?
Screenshots, up to 3 (optional)
or paste one with Ctrl+V

We use your email only to reply to you.

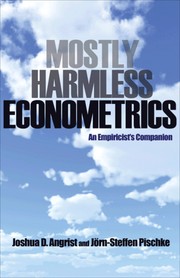
Mostly Harmless Econometrics

Mostly Harmless Econometrics

Joshua D. Angrist, Jorn-Steffen Pischke
2009
T2 392 pages · about 6h 32m to read Open Librarygoodreads

Summary

Joshua Angrist and Jorn-Steffen Pischke wrote this as a practical guide to causal inference for applied economists, and it changed how empirical economics is taught. The organising idea is that the credible identification of causal effects, not the sophistication of the estimator, determines whether a study means anything.

The framework is the potential outcomes model: for each unit there exists an outcome under treatment and an outcome without it, only one is observed, and the entire problem is constructing a credible comparison. The authors work through the research designs that achieve this. Randomised experiments supply the benchmark. Regression is treated as a way of approximating the conditional expectation function and as valid for causal purposes only under selection on observables. Instrumental variables are presented through the local average treatment effect framework, which specifies that the estimate applies to the compliers and not to the whole population. Differences-in-differences requires the parallel trends assumption, which the authors insist must be argued rather than asserted. Regression discontinuity exploits arbitrary thresholds in assignment rules.

The book is opinionated, funny in places, and dismissive of methods it considers unidentified, particularly structural modelling and much of time series macroeconometrics. It is aimed at graduate students and assumes regression at a solid level. The subsequent literature has qualified several of its recommendations, most notably on differences-in-differences with staggered treatment timing, where the two-way fixed effects estimator the book presents has been shown to be biased. The design-based approach it advocates is now standard, and Angrist shared a Nobel prize in 2021 for the work behind it.

Key takeaways 7

  1. The credibility of a causal claim rests on the research design rather than on the sophistication of the estimator.
  2. Every empirical study should start by naming the experiment it is trying to approximate, even when no experiment is possible.
  3. Instrumental variables estimate the effect on compliers only, so the estimate does not generalise to the whole population.
  4. Regression identifies causal effects only if treatment is as good as randomly assigned conditional on the controls included.
  5. Differences-in-differences requires that treated and control groups would have moved in parallel absent treatment, and this must be argued from evidence.
  6. Regression discontinuity uses arbitrary thresholds in assignment rules to create local comparisons that approximate randomisation.
  7. Standard errors must account for the level at which treatment varies, and ignoring clustering produces confidence intervals that are far too narrow.

Who should read it

Anyone who reads or produces empirical research on causal questions and needs to judge whether a study's design supports its claims.

Similar books 6

Chosen by shared topics, the entries that hold them, and the people who recommended both.
Peter Kennedy · 1998

What each econometric technique is for, what it assumes and what goes wrong.

Recommended by: Nassim Nicholas Taleb
Judea Pearl · 2000

A mathematical theory of causation for statistics, AI, economics and science.
Darrell Huff · 1954

How biased samples, chosen averages and cut-off chart axes make numbers mislead.

Charles Wheelan · 2013

Statistics without the maths, for reading claims: averages, correlation, regression.

Recommended by: Keith Rabois
David A. Freedman · 2009

Freedman on regression's assumptions and the causal claims it cannot support

Recommended by: Nassim Nicholas Taleb

Where it sits in the reference 2

Mental models
Economics

Topics

Mathematics and StatisticsEconomicsStatistics, probability and data