Updates

  1. Person pages list letters, writing, profiles and links as sortable tables with filters, and show each person's companies as links; Fund letters show each letter's description in its own column.
  2. Experts show a checked job title and a short description of each person; 30 more people have photographs.
  3. Every company, fund, university and publication the experts work for has a page listing the people there.
  4. Fund letters show each letter's thesis and filter by it; 225 person pages list the essays, columns and newsletter issues the person wrote.
  5. Person pages list every essay and newsletter issue a person wrote, and their own books as a table in List view.
  6. Recommends shows the five largest kinds of book and the rest under More; browse pictures load sooner.
  7. Podcasts and talks link the original episode, filter by Audio and video or Press, and list each publisher once.
  8. Pages are wider, Recommends has List and Grid, and a filter clicked again turns off.
  9. Book cards sit in a ruled grid with Open Library and Goodreads links and each book's one-line note.
  10. Funds is now Investors; each investor's styles are buttons that filter the table.
  11. Podcasts and talks on a person's page filter by year and publisher and show as a list or a grid of pictures.
  12. Quotes show only people's own words: 472 summaries written by list sites are gone.
  13. Country pages open from Browse again, and every link on the shelf lands on a page.
  14. Subject and person pages show their sections as tabs, and each book appears once on a person's page.
  15. Book cards show the quote, who said it and the source; grids show five cards to a row.
  16. On a phone, a menu holds the sections, search, Updates, Feedback and dark mode.
  17. Feedback takes a screenshot of the page with no browser prompt, opens a screenshot full size when you click it, and clears itself once sent.
  18. Book cards are centred, search names the topic each book sits in, and any text cut short shows whole on hover.
  19. Search groups its results by kind: people, companies, geographies, subjects, topics, books, funds, fund letters and papers.
  20. The Books table lists who recommended each book by name, and the browser tab names the section you are in.
  21. Feedback can take a screenshot of the page, or one you paste or choose, and opens in the corner beside Updates.
  22. Each rail button reopens its section where you left it, and Browse, Table and People show on every book and subject page.
  23. Filters grey out choices that hold nothing instead of hiding them, and Books › People filters by authors or recommenders.
  24. Feedback takes a subject line and up to three screenshots.
  25. Biographies are grouped by the person they are about: 41 new pages, from Abraham Lincoln to Lee Kuan Yew.
  26. Sport splits into 23 sports, and Religion into one topic per faith.
  27. Book lists show as cards: the cover, one recommendation quote and every recommender by name.
  28. Seventeen subjects that had two or three pages under different names now have one page each.
  29. Every page lists its Experts as authors and recommenders, with a link to them on the Experts tab.
  30. Economics, Financial history, Financial panics and Accounting are subjects of their own, with one page per financial crisis.
  31. Book, person and subject pages open inside the app, so the tabs stay in view.
  32. 996 more book covers, and photographs or logos for 227 more people and companies.
  33. Books › Browse shows every subject as cards, and the rail holds Fund letters, Papers, Experts, Books and Funds.
  34. Every topic over 150 books splits into narrower topics, each with a page of its own.

Send feedback

What is it?
Screenshots, up to 3 (optional)
or paste one with Ctrl+V

We use your email only to reply to you.

Correlation versus Causation

Two series moving together says nothing about which moves the other, or whether a third thing moves both. Backtests, factor discoveries and management explanations all trade on the confusion. The corrective is to name the mechanism and specify what you would observe if the causal story were false.

Start here

  1. How to Lie with StatisticsDarrell Huff, 1954
  2. Naked StatisticsCharles Wheelan, 2013
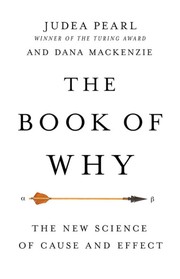
  3. The Book of WhyJudea Pearl, Dana Mackenzie, 2018
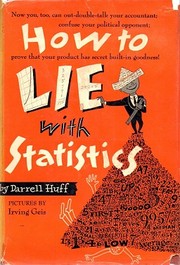
Darrell Huff · 1954

How biased samples, chosen averages and cut-off chart axes make numbers mislead.

Judea Pearl, Dana Mackenzie · 2018

How the science of cause and effect moved past 'correlation is not causation'.

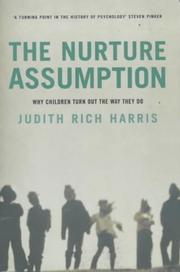
Judith Rich Harris · 1998

Why parents have less effect on how children turn out than people assume.

“the one thing that I found to be really interesting, and to some degree liberating, is the work of Judith Rich Harris” — Michael Mauboussin

Source: The Tim Ferriss Show #659 — official transcript

Recommended by: Michael Mauboussin
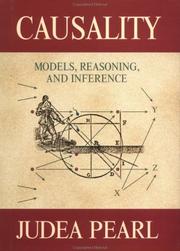
Judea Pearl · 2000

A mathematical theory of causation for statistics, AI, economics and science.
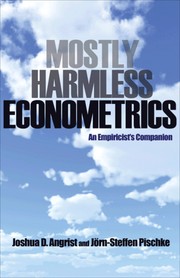
Joshua D. Angrist, Jorn-Steffen Pischke · 2009

A practical guide to causal inference: regression, instruments, differences.
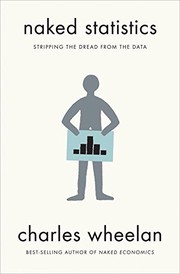
Charles Wheelan · 2013

Statistics without the maths, for reading claims: averages, correlation, regression.

Recommended by: Keith Rabois
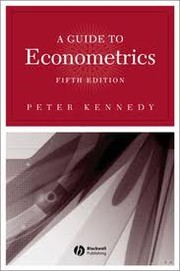
Peter Kennedy · 1998

What each econometric technique is for, what it assumes and what goes wrong.

Recommended by: Nassim Nicholas Taleb
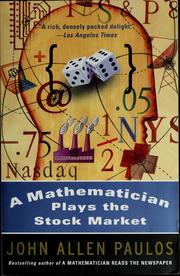
John Allen Paulos · 2003

A mathematician's own losses used to explain market probability errors

Recommended by: Mohnish Pabrai
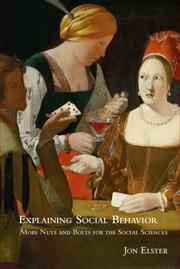
Jon Elster · 2007

Elster on mechanisms rather than laws in the social sciences

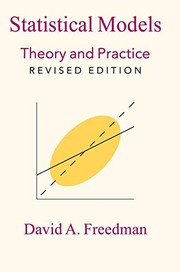
David A. Freedman · 2009

Freedman on regression's assumptions and the causal claims it cannot support

Recommended by: Nassim Nicholas Taleb
More mental models