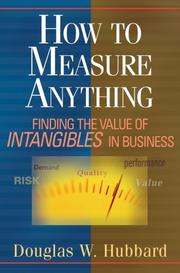
How to Measure Anything
Calibration and the value of information applied to intangibles.
Summary
Hubbard argues that anything a manager cares about can be measured, and that the objection that something is immeasurable rests on three confusions: about what measurement is, about what the object of measurement is, and about the methods available. He defines measurement as a reduction in uncertainty based on observation, expressed as a probability distribution rather than as a point estimate.
The method has several parts. First, define the decision the measurement is meant to inform, since a measurement that cannot change a decision has no value. Second, express current uncertainty as a calibrated probability interval, and Hubbard supplies calibration training exercises showing that most people are badly overconfident and that calibration is a learnable skill. Third, compute the expected value of information for each variable, which usually shows that the variables people want to measure have low information value and that a few overlooked ones dominate. Fourth, measure only those, using the cheapest method that reduces uncertainty, including small samples, decomposition, controlled experiments and Fermi estimation. He is emphatic that small samples carry far more information than people assume, and gives the rule of five, that the median of any population lies between the smallest and largest of five random samples about ninety-four percent of the time.
Hubbard also attacks common alternatives, particularly weighted scoring models and risk matrices, arguing they add noise rather than information. The book is practical and the calibration and expected-value-of-information material is directly usable. Its weakness is that Hubbard's own consulting method is presented as more settled than the evidence supports, and some case results are asserted rather than documented.
Key takeaways 7
- Measurement is a reduction in uncertainty from observation, not the achievement of an exact value, which means partial information counts as measurement.
- A measurement is worth making only if it can change a decision, so the decision must be specified before the metric is chosen.
- Most managers are badly overconfident in their estimates, and calibration to accurate ninety percent intervals is a trainable skill that takes a few hours.
- Computing the expected value of information usually shows that the variables people most want to measure carry little value and that a few ignored ones dominate.
- Very small samples reduce uncertainty far more than intuition suggests, and five random observations bracket the population median about ninety-four percent of the time.
- Weighted scoring models and coloured risk matrices add noise rather than information and perform worse than simple quantitative estimates.
- Any quantity, including reputation, quality or management effectiveness, can be decomposed into observable consequences that are measurable.
Who should read it
Operators and investors who need to quantify supposedly unmeasurable variables before a decision, and who want a working method for calibrated estimation.
Who recommended it 2
Similar books 6
Chosen by shared topics, the entries that hold them, and the people who recommended both.
Why some forecasts succeed and most fail, from weather to earthquakes and economics.
Recommended by: Bill Gates, Mohnish Pabrai, Sophie Bakalar
The Good Judgment Project; the practices that measurably improve forecasts.
Recommended by: Patrick Collison and 9 others
A 20-year test of 28,000 expert forecasts: foxes with many models beat hedgehogs.
“All pundits and commentators should publish their prediction track records, yet don't. What to pay attention to and what to ignore.” — Marc Andreessen
Source: @pmarca, 'Thread: Books I've recently read and recommend'
Recommended by: Marc Andreessen, Michael Mauboussin and 2 others
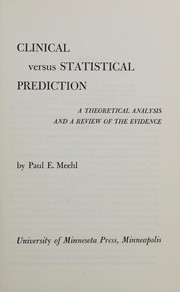
Recommended by: Daniel Kahneman
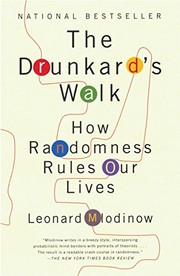
How randomness shapes our lives, the history of probability, and why we misread it.
Recommended by: Patrick Collison
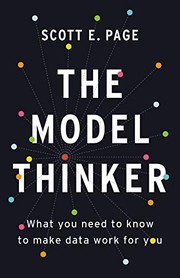
Recommended by: Keith Rabois, Michael Mauboussin
Where it sits in the reference 2
Topics