Updates

  1. Person pages list letters, writing, profiles and links as sortable tables with filters, and show each person's companies as links; Fund letters show each letter's description in its own column.
  2. Experts show a checked job title and a short description of each person; 30 more people have photographs.
  3. Every company, fund, university and publication the experts work for has a page listing the people there.
  4. Fund letters show each letter's thesis and filter by it; 225 person pages list the essays, columns and newsletter issues the person wrote.
  5. Person pages list every essay and newsletter issue a person wrote, and their own books as a table in List view.
  6. Recommends shows the five largest kinds of book and the rest under More; browse pictures load sooner.
  7. Podcasts and talks link the original episode, filter by Audio and video or Press, and list each publisher once.
  8. Pages are wider, Recommends has List and Grid, and a filter clicked again turns off.
  9. Book cards sit in a ruled grid with Open Library and Goodreads links and each book's one-line note.
  10. Funds is now Investors; each investor's styles are buttons that filter the table.
  11. Podcasts and talks on a person's page filter by year and publisher and show as a list or a grid of pictures.
  12. Quotes show only people's own words: 472 summaries written by list sites are gone.
  13. Country pages open from Browse again, and every link on the shelf lands on a page.
  14. Subject and person pages show their sections as tabs, and each book appears once on a person's page.
  15. Book cards show the quote, who said it and the source; grids show five cards to a row.
  16. On a phone, a menu holds the sections, search, Updates, Feedback and dark mode.
  17. Feedback takes a screenshot of the page with no browser prompt, opens a screenshot full size when you click it, and clears itself once sent.
  18. Book cards are centred, search names the topic each book sits in, and any text cut short shows whole on hover.
  19. Search groups its results by kind: people, companies, geographies, subjects, topics, books, funds, fund letters and papers.
  20. The Books table lists who recommended each book by name, and the browser tab names the section you are in.
  21. Feedback can take a screenshot of the page, or one you paste or choose, and opens in the corner beside Updates.
  22. Each rail button reopens its section where you left it, and Browse, Table and People show on every book and subject page.
  23. Filters grey out choices that hold nothing instead of hiding them, and Books › People filters by authors or recommenders.
  24. Feedback takes a subject line and up to three screenshots.
  25. Biographies are grouped by the person they are about: 41 new pages, from Abraham Lincoln to Lee Kuan Yew.
  26. Sport splits into 23 sports, and Religion into one topic per faith.
  27. Book lists show as cards: the cover, one recommendation quote and every recommender by name.
  28. Seventeen subjects that had two or three pages under different names now have one page each.
  29. Every page lists its Experts as authors and recommenders, with a link to them on the Experts tab.
  30. Economics, Financial history, Financial panics and Accounting are subjects of their own, with one page per financial crisis.
  31. Book, person and subject pages open inside the app, so the tabs stay in view.
  32. 996 more book covers, and photographs or logos for 227 more people and companies.
  33. Books › Browse shows every subject as cards, and the rail holds Fund letters, Papers, Experts, Books and Funds.
  34. Every topic over 150 books splits into narrower topics, each with a page of its own.

Send feedback

What is it?
Screenshots, up to 3 (optional)
or paste one with Ctrl+V

We use your email only to reply to you.

The Signal and the Noise

The Signal and the Noise

Nate Silver
2012
T4 552 pages · about 9h 12m to read Open Librarygoodreads

Summary

Silver examines forecasting across domains where records exist, and argues that the difference between good and bad forecasting is a specific set of practices rather than better models or more data.

The domains he covers include weather forecasting, which he identifies as one of the genuine success stories with measurable improvement over decades; earthquakes, where he argues prediction is not currently possible and the attempts have produced false confidence; economics, where he documents that forecasters do not publish confidence intervals and that the intervals they do have are far wider than users assume; baseball, poker, chess, political polling, epidemiology and climate.

His central prescription is Bayesian reasoning, meaning starting from a prior probability, updating it in proportion to how diagnostic new evidence is, and stating beliefs as probabilities rather than as positions. He argues that the failure to state a prior is what makes most forecasting unfalsifiable and unimprovable. His analysis of the 2008 crisis identifies four specific failure points: the rating agencies' models assumed regional rather than national default correlation, the housing boom was treated as sustainable, the effects of the collapse were underestimated, and the models were built on data from a period containing no comparable event.

The book was published in 2012 and Silver's own subsequent forecasting record has been mixed, particularly around 2016, which he addressed by noting his model gave a higher probability than others. The critique that Bayesian methods depend on the prior, which is chosen rather than derived, applies to his prescription. The domain comparisons are the most valuable part.

Key takeaways 8

  1. Forecasting quality differs enormously by domain, and weather forecasting has improved measurably while economic forecasting has not.
  2. Beliefs should be stated as probabilities and updated in proportion to how diagnostic new evidence is, which is the Bayesian prescription.
  3. Failing to state a prior probability makes a forecast unfalsifiable and therefore unimprovable.
  4. Economic forecasts are published without confidence intervals, and the actual intervals are far wider than users assume.
  5. Rating agency models before 2008 assumed regional rather than national correlation in mortgage defaults, which invalidated every conclusion drawn from them.
  6. Models built on data from a period containing no comparable event contain no information about such an event.
  7. More data increases the number of spurious relationships available, which means better data does not automatically produce better forecasts.
  8. Forecasters who make many small updates outperform those who hold a position and revise it dramatically or not at all.

Who should read it

Anyone who makes or consumes forecasts and wants a comparison of which domains forecast well and what the successful ones do differently.

Who recommended it 3 · 2 direct

Similar books 6

Chosen by shared topics, the entries that hold them, and the people who recommended both.
Philip E. Tetlock · 2005

A 20-year test of 28,000 expert forecasts: foxes with many models beat hedgehogs.

“All pundits and commentators should publish their prediction track records, yet don't. What to pay attention to and what to ignore.” — Marc Andreessen

Source: @pmarca, 'Thread: Books I've recently read and recommend'

Recommended by: Marc Andreessen, Michael Mauboussin and 2 others
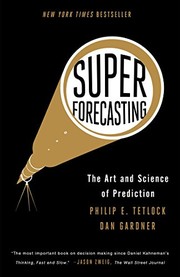
Philip E. Tetlock, Dan Gardner · 2015

The Good Judgment Project; the practices that measurably improve forecasts.

Douglas W. Hubbard · 2007

Calibration and the value of information applied to intangibles.

Recommended by: Julia Galef, Nick Ganju
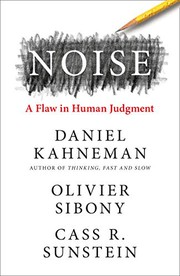
Daniel Kahneman, Olivier Sibony, Cass R. Sunstein · 2021

Kahneman died 27 March 2024; this was his last book.
Darrell Huff · 1954

How biased samples, chosen averages and cut-off chart axes make numbers mislead.

Where it sits in the reference 3

Investment philosophy
Mental models
Mental models

Topics

Mathematics and StatisticsDecision MakingStatistics, probability and data